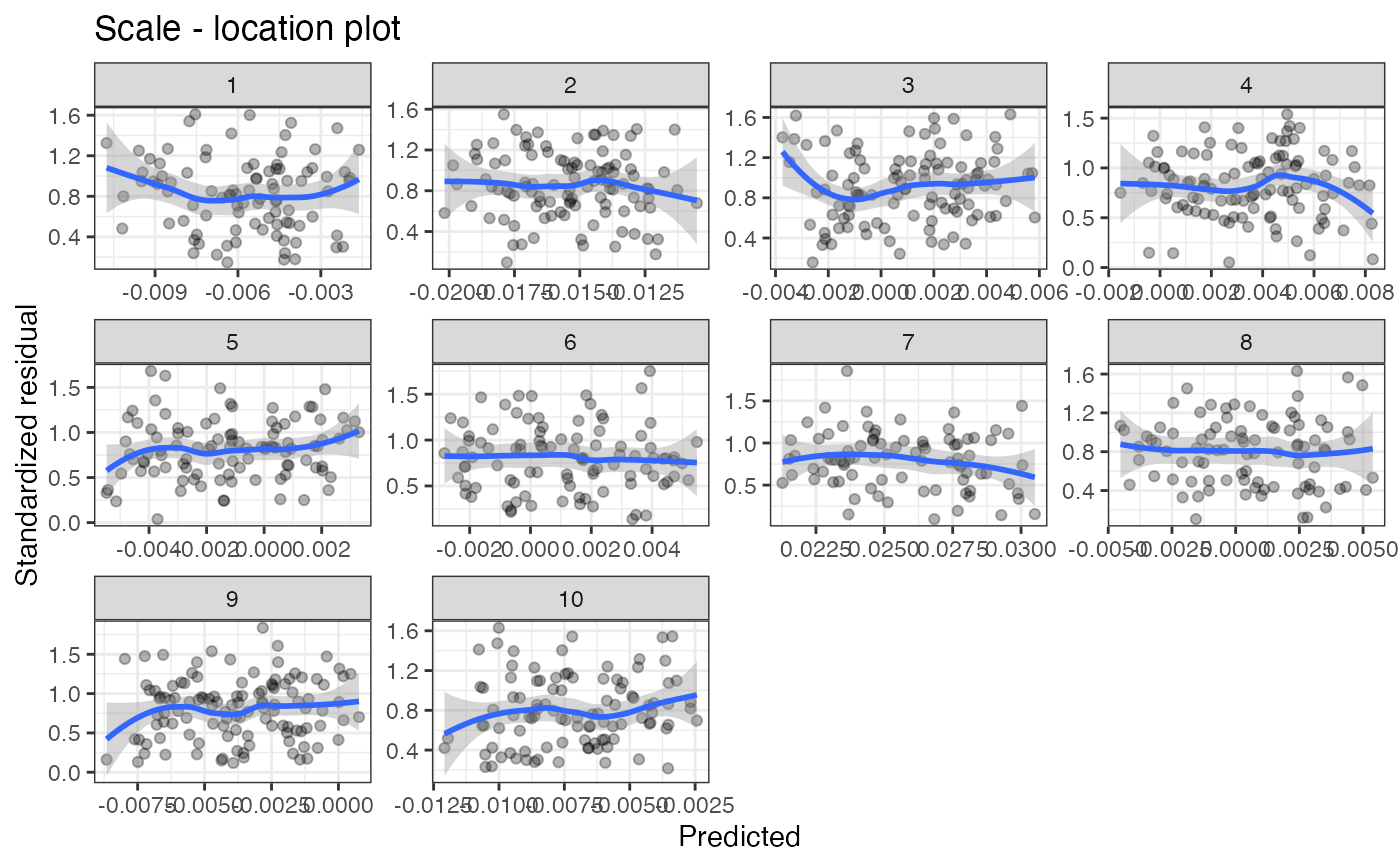
scale_loc
scale_loc(
  df,
  time = "time",
  pred = "pred",
  resid = "resid",
  by_time = TRUE,
  add_smooth = TRUE
)
Arguments
- df
Dataframe, containing locations, time, and predictions
- time
Character string containing the name of time variable
- pred
Character string containing the name of prediction variable
- resid
Character string containing the name of residual variable
- by_time
Whether to facet by time (default = TRUE) or not
- add_smooth
Whether to include a smoothed line via geom_smooth (default = TRUE)
Value
A ggplot object that can be manipulated further
Examples
# \donttest{
set.seed(2021)
d <- data.frame(
  X = runif(1000), Y = runif(1000),
  year = sample(1:10, size = 1000, replace = TRUE)
)
d$density <- rnorm(0.01 * d$X - 0.001 * d$X * d$X + d$Y * 0.02 - 0.005 * d$Y * d$Y, 0, 0.1)

m <- mgcv::gam(density ~ 0 + as.factor(year) + s(X, Y), data = d)
d$pred <- predict(m)
d$resid <- resid(m)
# the default names match, with the exception of year -- so change it
scale_loc(d, time = "year")
#> `geom_smooth()` using method = 'loess' and formula 'y ~ x'

# }
# }